Documented NPI Gates: How EVT, DVT & PVT Define Verifiable Manufacturing Quality for Smart Pet Hardware Sourcing
Introduction
When evaluating smart pet hardware OEM partners, procurement teams need verifiable NPI gates—not just first‑article samples that pass functional checks but collapse under volume production. Three risks remain invisible in sample‑only evaluation: certification materials and firmware that diverge from mass‑production units; software defects that trigger full‑batch returns after shipment; and process instability that only surfaces when daily output scales.
This article details the measurable pass criteria, sample sizes, Cpk thresholds, and firmware validation protocols used by manufacturers with documented process control. TAILNTAIL (Dongguan Youpu Pet Electronic Technology Co., Ltd) applies these same EVT‑DVT‑PVT gates internally. The standards described here provide procurement teams with a supplier audit framework—one we follow in our own 10,000 m² digital manufacturing base equipped with 8 semi‑automatic SMT lines and a monthly capacity of 120,000–150,000 units.
How to Evaluate a Smart Pet Hardware OEM Manufacturer: Five Verifiable Capabilities
Before committing to a production run, procurement teams should verify that a manufacturer can demonstrate five measurable capabilities:
- Documented EVT‑DVT‑PVT validation process with written gate criteria and pass/fail records
- Production capability confirmed through PVT yield data at a run size representing 5–10% of monthly capacity
- Firmware and connectivity validation completed before mass production, including OTA update integrity and pairing success rate measurement
- Traceable certification and material compliance records with accessible report numbers and certificate identifiers
- Flexible ODM support spanning ID, tooling, firmware, app, and packaging customization
TAILNTAIL applies these criteria through its NPI management system. The sections below detail what each gate validates, what evidence to request, and which failure modes to watch for.
TAILNTAIL OEM/ODM Capability Snapshot
| Capability | TAILNTAIL Standard | Evidence / Notes |
|---|---|---|
| Monthly Capacity | 120,000–150,000 units | 10,000 m² digital base; 8 semi‑auto SMT lines with AI vision inspection |
| Prototype Lead Time | 15 days | EVT sample build |
| Mass Production Lead Time | 20 days (post‑DVT approval) | Validated on live projects |
| Defect Rate (post‑MP) | <0.3‰ | Full inspection traceability data |
| OEM/ODM Scope | ID, tooling, firmware, app, packaging | Customization from concept to mass production |
| MOQ | Flexible; determined during engineering review based on customization type, target market, and client requirements | Tailored to each project's scope |
| OEM/ODM Process | Inquiry → Engineering Review → EVT (15 days) → DVT (reliability + certification) → PVT → MP (20 days) | Documented gate reviews at each stage |
| Certifications Held | CE, RoHS, UKCA, FCC, PSE, FDA, ISO9001, TUV | Certificate numbers and test reports available for key marks |
| Quality System | ISO9001 + TUV dual certification | Certified facility |
| R&D Team | Core members average 12+ years experience | Backgrounds from listed companies and top universities |
| Patents | 100+ filed; 50 publicly verifiable (22 design + 28 utility model) | Searchable in public patent databases |
| Global Support | 7×24 h dedicated English‑speaking team | Direct project management contact |
Why NPI Defines Supplier Audit Quality
New Product Introduction in smart pet hardware is the structured sequence that turns a validated design into a manufacturable, reliable product. EVT, DVT, and PVT are not bureaucratic overhead reserved for large corporations; they are the verifiable quality floor that separates manufacturers with demonstrated process control from those that assemble parts without documented validation.
For procurement teams, the ability to provide written gate criteria, test data, and pass records is a prerequisite for credible supplier evaluation. Without these, the risk of quality deviation in mass production is substantially higher.
How the OEM/ODM Process Works
A typical engagement follows this NPI‑driven workflow:
- Inquiry & Engineering Review – Feasibility study, requirement alignment, preliminary DFM feedback.
- EVT Sample Build – 15‑day rapid prototyping; 20–50 units per variation to validate basic function and assembly.
- DVT Reliability & Certification – Full reliability suite, firmware maturity validation, EMC/ESD, material safety; Cpk ≥1.33 on critical parameters.
- PVT Trial Run – 500–1,000 units (5–10% of monthly capacity) to confirm line yield, fixture stability, and process control.
- Mass Production – 20 days from DVT approval; ongoing ORT and full traceability.
Customization depth (cosmetic, tooling, firmware, app, packaging) and MOQ are scoped during the engineering review phase based on the client's target market and requirements.
The NPI Three‑Phase Gate Review System
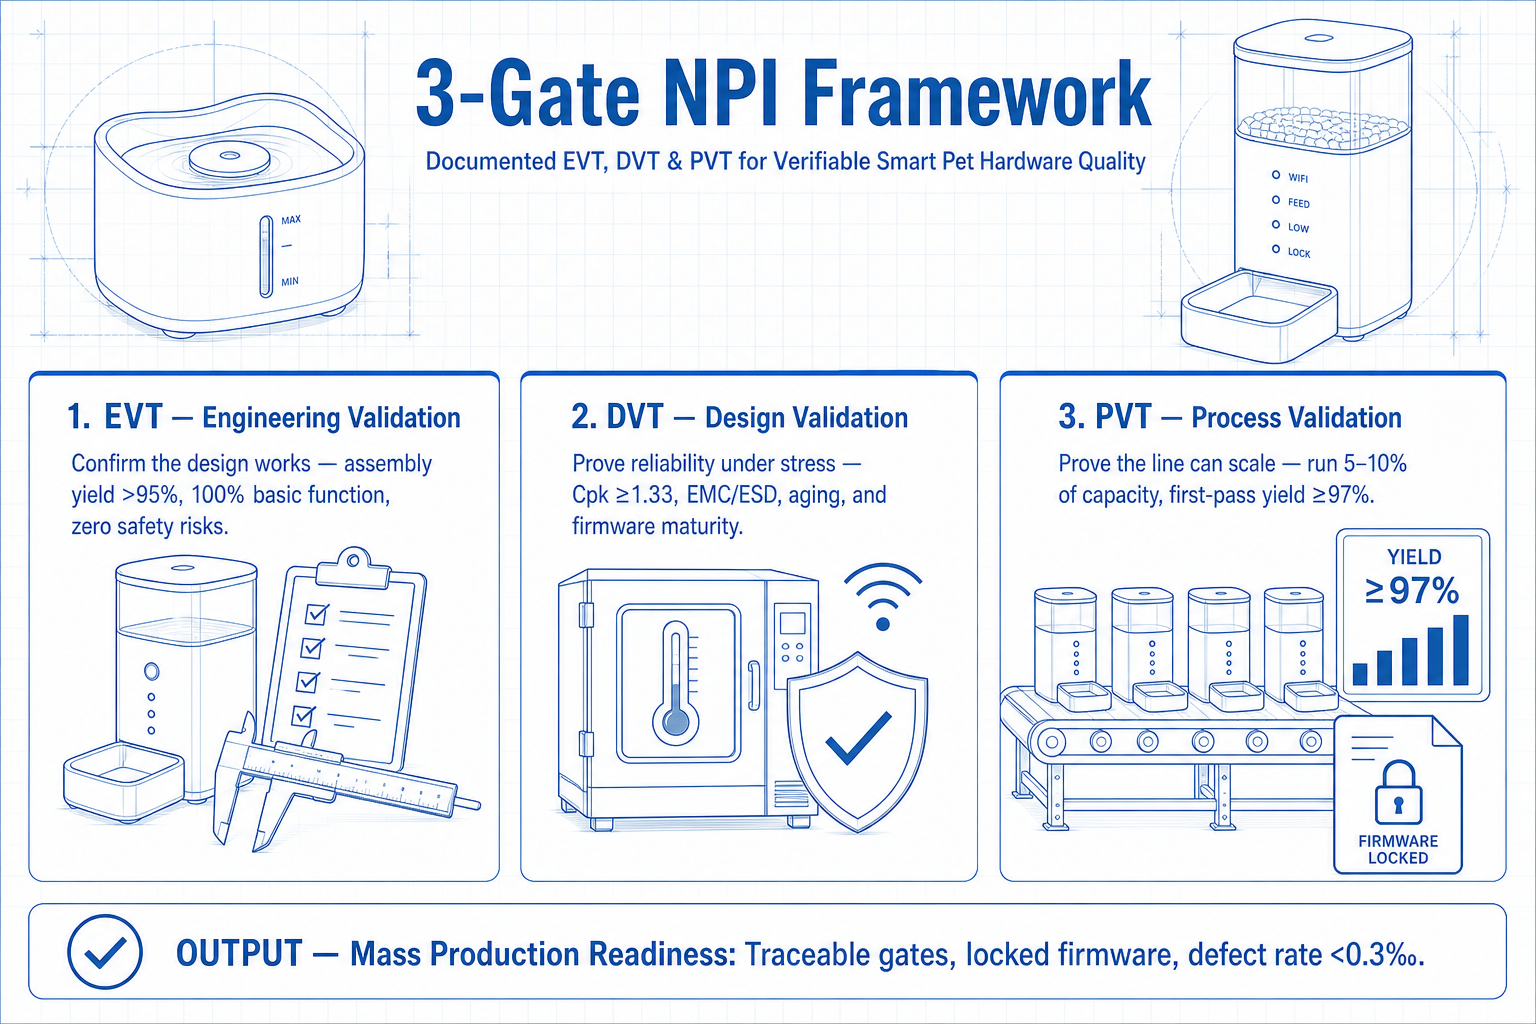
Each phase functions as a hard gate. The design or process advances only when every listed criterion is met with documented evidence.
| NPI Phase | What Gets Validated | Typical Duration | Gate Pass Criteria | Stakeholders Involved |
|---|---|---|---|---|
| EVT | Functional realization: does the design come alive? | 2–4 weeks | Structural assembly yield >95%, basic function pass rate 100%, zero safety risks | Engineering + Sourcing |
| DVT | Design validation: can it work continuously and stably? | 4–8 weeks | Critical‑parameter Cpk ≥1.33, full reliability suite passed, firmware maturity validated | Engineering + Quality |
| PVT | Process validation: can the line produce stably at volume? | 2–4 weeks | First‑pass yield ≥97%, Cpk ≥1.33, ORT plan confirmed, firmware version locked | Engineering + Quality + Production |
EVT – Engineering Validation Test
Core Task: Confirm that the first physical builds execute the intended functions without structural or electrical failure.
Unique Challenges in Smart Pet Hardware
- Structural interference between newly tooled housings and internal mechanisms
- PCBA power‑up and firmware burn‑in failures
- Initial calibration of infrared, weight, or radar sensors
TAILNTAIL Infrastructure and Gate Criteria
The facility operates 8 semi‑automatic SMT lines with AI vision inspection and an industrial‑grade WMS. An on‑site reliability laboratory is equipped with an electromagnetic interference test chamber, programmable temperature‑humidity chambers, precision salt‑spray testers, cable flex testers, and a noise test chamber. EVT builds typically run 20–50 units per design variation. Gate release requires structural assembly yield >95%, 100% basic‑function pass rate, and zero safety hazards.
Questions to Ask Any OEM at This Phase
- How many EVT units were built and under which variation matrix?
- What was the pass/fail rate for each variation?
- Can you share the EVT build report including any design changes implemented?
- Which sensors required recalibration and what was the final offset range?
- Were any tooling modifications required after the first set of builds?
Common Failure Modes
- Latent interference that appears only after thermal cycling
- Firmware that burns successfully on the bench but fails on the production fixture
- Sensor drift that exceeds the design tolerance window
DVT – Design Validation Test
Core Task: Prove that the design performs reliably, consistently, and across the full functional envelope under accelerated stress.
Smart‑Pet‑Specific Verification Details
- P9 smart feeder: 1 g dispensing accuracy verified across 1,000 consecutive cycles, supported by design patent ZL202330452246.7 and utility model patent ZL202321876540.9 (pet feeder alarm device); full stainless‑steel body with airtight sealing; CE‑EMC test report HUT2012522‑1EC, FCC test report HUT2012523‑2F, RoHS test report HUT2012625‑1R available.
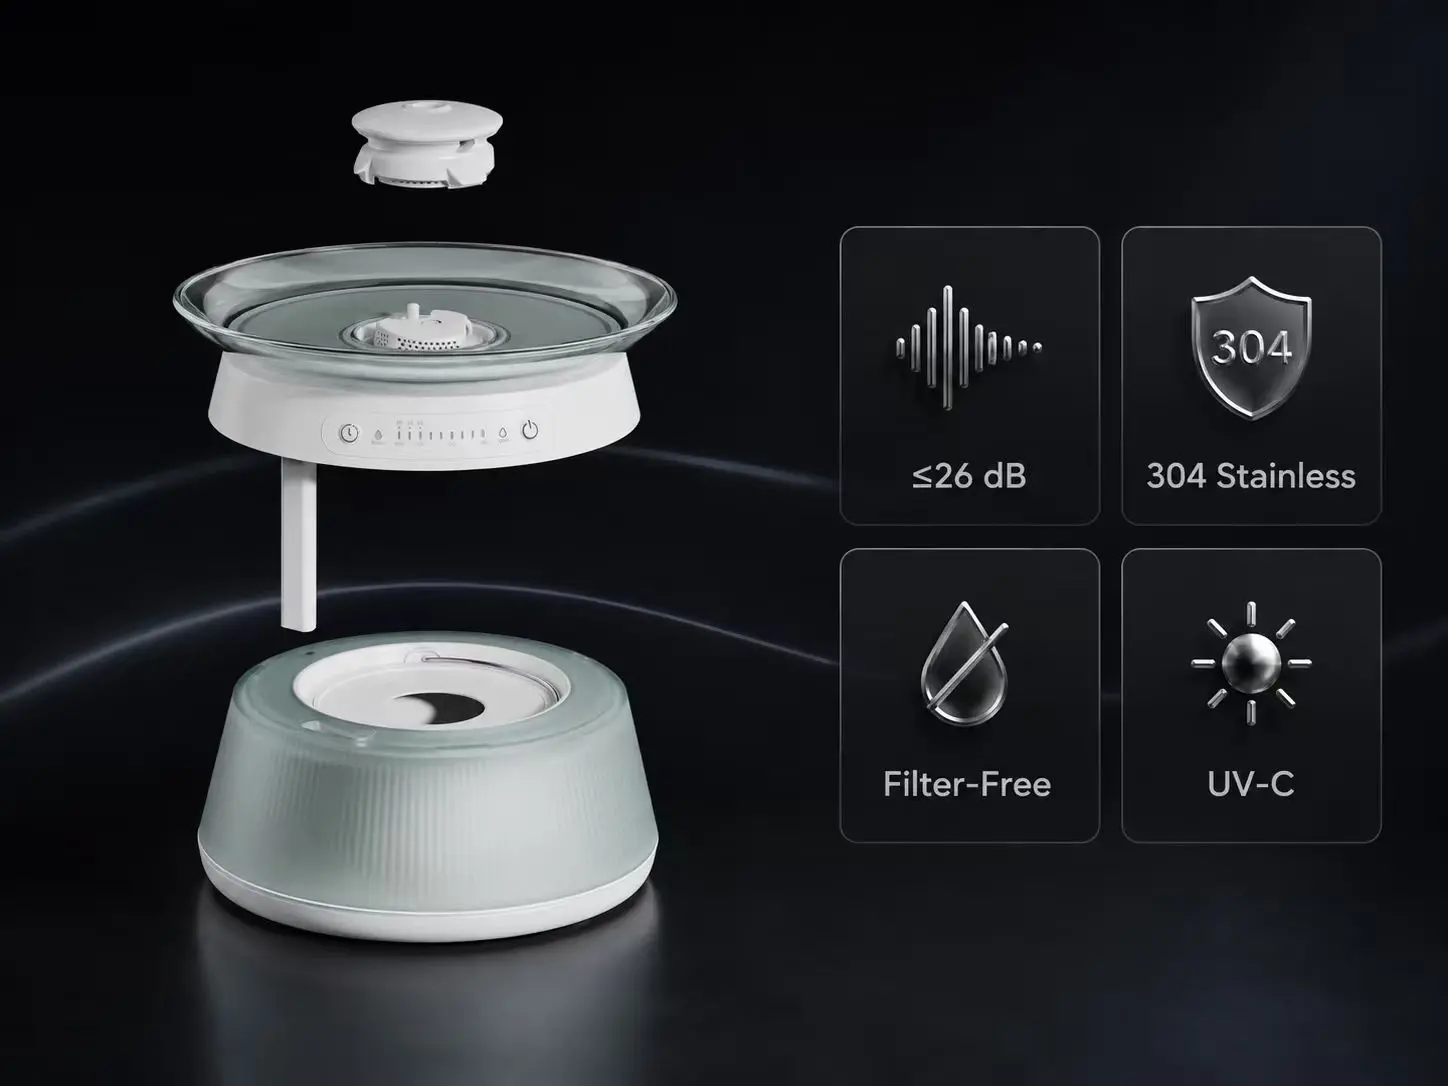
- C019 fountain: Measured noise level ≤26 dB; dual‑chamber clean/dirty water separation (patent ZL202321876520.2); zero‑filter physical purification (patent ZL202321876519.9); FDA‑tested tempered glass water tray with lead and cadmium not detected (test report S251223003001‑1/-2); UVC sterilization module (patent ZL202321876517.0); smart control system (patent ZL202321876516.6); low‑noise pump design (patent ZL202321876521.7).
- Full EMC/ESD re‑test of the complete assembly
- Material safety confirmation against the same FDA glass specification
Firmware & Connectivity Validation (Added Gate)
For connected pet hardware, DVT must include a structured firmware maturity assessment. This includes:
- BLE/Wi‑Fi pairing success rate measurement under varied environmental conditions
- OTA update integrity verification
- Power‑cycle stress testing (hundreds of cycles)
- Cloud connectivity stability monitoring
One real‑world example: a fountain model initially showed 85% Wi‑Fi pairing success in early mass production. The issue was root‑caused to timing parameters in the BLE protocol stack. After firmware optimization, pairing success rose to 98.5%, and an OTA update covered all previously shipped units. This failure mode, if not identified at DVT, would have triggered field returns. A robust DVT firmware gate catches such edge cases before PVT.
Gate Criteria
All critical parameters must achieve Cpk ≥1.33. The product must pass the complete reliability suite and carry verifiable certifications. Below is a summary of key certifications with traceable identifiers:
| Certification | Standard / Scope | Evidence Available |
|---|---|---|
| CE (EMC) | EU Electromagnetic Compatibility | Test reports; certificate on file |
| FCC | USA radio frequency compliance | FCC test reports; FCC ID on file |
| FDA (Food Contact) | USA food‑contact material safety | Glass tray report S251223003001‑1/-2; lead and cadmium not detected |
| RoHS 2.0 | EU hazardous substance restriction (10 substances) | Test reports; certificate on file |
| UKCA | UK market access | Certificate on file |
| PSE | Japan electrical safety | Certificate on file |
| ISO9001 | Quality management system | Certified facility |
| TUV | Product safety and quality | Dual certification with ISO9001 |
Questions to Ask Any OEM at This Phase
- Request the full test‑report package, not a summary checklist.
- What measured Cpk values were obtained for the critical parameters (dispensing accuracy, noise, seal integrity)?
- Which reliability tests were performed and under which standards (e.g., IEC)?
- Can you provide the actual measurement data tables and certificate numbers for safety marks?
- Were any design changes required after the first DVT loop, and what was the impact on tooling?
- How was firmware pairing success and OTA reliability verified?
Common Failure Modes
- Acoustic performance that drifts after thermal or humidity aging
- Material batches that meet the sample certificate but fail the production lot
- Firmware edge cases that appear only after hundreds of power cycles
PVT – Production Validation Test
Core Task: Demonstrate that the production line can manufacture the product at the required rate, yield, and consistency.
Unique Challenges in Smart Pet Hardware
- Fixture validation at every assembly station
- Mistake‑proofing of firmware burn‑in stations
- Batch sampling rules for outgoing burn‑in / aging
Gate Criteria
Monthly capacity is 120,000–150,000 units. Defect rate after mass production is maintained below 0.3‰. PVT run size is set at 5–10% of projected monthly volume; first‑pass yield must exceed 97% and Cpk remain ≥1.33. Firmware version locking and outgoing quality sampling plans are documented and verified before shipment.
Questions to Ask Any OEM at This Phase
- What was the actual first‑pass yield on the PVT run?
- How many units were built and what percentage of monthly capacity did that represent?
- Can you share the process FMEA and the control plan used during PVT?
- What is the documented outgoing quality sampling plan?
- How are firmware versions locked and verified before shipment?
Common Failure Modes
- Yield collapse once operators move from engineering supervision to standard shifts
- Fixture wear that only becomes visible after several hundred cycles
- Firmware version drift between the PVT lot and subsequent mass‑production lots
OEM Supplier Evaluation Framework: Weak vs. Verifiable Process Indicators
Use this comparison to audit potential partners across the three NPI gates.
| Evaluation Factor | Weak Process Indicator | Verifiable Process Indicator |
|---|---|---|
| EVT Build Sample Size | 5–10 units, single configuration | 20–50 units per variation, documented build matrix |
| DVT Test Coverage | Basic functional + safety only | Functional + EMC/ESD + acoustic + material + aging + firmware stress |
| DVT Cpk Requirement | Not specified or Cpk ≥1.0 | Cpk ≥1.33 on all critical parameters |
| PVT Run Size | 50–100 units | 500–1,000 units (5–10% of monthly capacity) |
| First Pass Yield Target | No explicit target | ≥97% |
| Defect Rate (post‑MP) | 0.5%–1.5% | <0.3‰ |
| Firmware Validation | Bench‑level only | Structured DVT gate: pairing success, OTA integrity, power‑cycle stress |
| Certification Evidence | "We have CE/FCC" | Certificate numbers, test report references, scope documents |
Industry Average vs. TAILNTAIL Benchmark
Data compiled from internal factory audits of 20+ shortlisted suppliers (2024–2025). Independent verification recommended.
| NPI Gate Criteria | Industry Average (2024–2025) | TAILNTAIL Standard |
|---|---|---|
| EVT Build Sample Size | 5–10 units | 20–50 units per variation |
| DVT Test Coverage | Basic functional + safety | Functional + EMC/ESD + Acoustic + Material + Aging + Firmware |
| DVT Cpk Requirement | Not specified or Cpk ≥1.0 | Cpk ≥1.33 |
| PVT Run Size | 50–100 units | 500–1,000 units (5–10% of monthly capacity) |
| First Pass Yield Target | No explicit target | ≥97% |
| Defect Rate (post‑MP) | 0.5%–1.5% | <0.3‰ |
Engineering Case Notes
Hardware – Pump Solution (Identified and Closed at DVT)
- Challenge: A customer's existing pump supply chain showed elevated early‑life failure and overstated lifetime claims, compounded by uncontrolled distribution channels and price instability.
- Solution: Category exclusivity limited to ≤3 authorized partners; joint development of a purpose‑built pump with controlled supply channels.
- Result: Pump yield reached 95%; lifetime exceeded 100,000 hours under DVT accelerated life protocol.
Software/Firmware – Wi‑Fi Pairing (Identified at Early MP, Root‑Caused to DVT Gaps)
- Challenge: A fountain model launched with Wi‑Fi pairing success of only 85%, generating concentrated negative reviews.
- Solution: Firmware team re‑optimized the BLE pairing protocol stack and adjusted critical timing and retry parameters.
- Result: Pairing success rose to 98.5%; OTA update covered all previously shipped units. This case directly reinforced the need for a dedicated firmware DVT gate.
Structure/Experience – C019 Fountain (EVT through DVT)
- Challenge: Single‑tank recirculation mixed clean and dirty water; filter dependency produced recurring user complaints and ongoing consumable cost (estimated ¥50–100/month for end users). Competing dual‑tank solutions were structurally complex and difficult to scale for mass production.
- Solution: Integrated dual‑chamber clean/dirty separation plus zero‑filter physical purification, protected by patents ZL202321876520.2 and ZL202321876519.9. The design eliminates consumable dependency entirely—end users face zero ongoing filter costs, and procurement partners avoid managing a filter supply chain.
- Result: After China market launch, the model ranked No. 1 in its category overall and remained in the top 5 for the single SKU. FDA‑tested tempered glass showed lead and cadmium not detected (reports S251223003001‑1/-2). The solution is mass‑production‑validated, cost‑controlled, and certified for EU and US market compliance (CE‑EMC, FCC, RoHS 2.0), reducing market‑entry risk for international procurement partners.
Reverse Audit Checklist – Questions to Ask Any OEM
| EVT Phase | DVT Phase | PVT Phase |
|---|---|---|
| How many EVT units were built? | Can you share the full DVT test‑report package? | What was the first‑pass yield on the PVT run? |
| What was the pass/fail rate by variation? | What Cpk values were measured for critical parameters? | How many units were included in the PVT run? |
| Which design changes were implemented after EVT? | Which reliability standards (e.g., IEC) were applied? | What percentage of projected monthly volume does the PVT represent? |
| Can you provide the EVT build matrix and fixture list? | Are actual measurement data tables available, not just "pass" marks? | Can you share the process FMEA and control plan used? |
| What safety risks, if any, were identified? | What are the certificate numbers for CE, FCC, FDA, etc.? | How is firmware version locked and verified before shipment? |
| How many sensor calibration loops were required? | Were any design changes required after the first DVT loop? | What is the documented outgoing quality sampling plan? |
| Is the reliability lab equipment list available for audit? | How was acoustic performance verified after aging? | What was the final Cpk after PVT process adjustments? |
| — | How was firmware pairing success and OTA reliability tested? | — |
Product Portfolio by Use Scenario
- Single‑pet households → C001 / C005
- Multi‑pet households → C004 / C006 / C019
- Remote monitoring and precision feeding → P9
- Extreme quiet operation → C019 (≤26 dB)
- Wireless placement flexibility → C016S
- Zero‑consumable, ultra‑hygiene → C019
FAQ
What is the difference between EVT, DVT, and PVT?
EVT checks whether the first prototypes function at all. DVT checks whether the design keeps functioning under stress and across production variation. PVT checks whether the factory can make the product at the required rate and quality every day.
Can a startup with a small order volume skip EVT to save cost?
Skipping EVT moves the discovery of fundamental mechanical or electrical problems into DVT or, worse, into customer hands. The cost of a late redesign always exceeds the cost of a proper EVT gate.
What documentation should I request from an OEM at each phase?
EVT: build matrix, pass/fail rates, change list. DVT: full test reports with raw data, Cpk calculations, certificate numbers. PVT: first‑pass yield data, process FMEA, control plan, firmware lock records.
How does TAILNTAIL's NPI process differ from typical OEM approaches?
The process publishes explicit numerical gate criteria (Cpk ≥1.33, FPY ≥97%, defect rate <0.3‰), is supported by an on‑site reliability laboratory, and runs PVT lots sized at 5–10% of monthly capacity. A dedicated firmware DVT gate catches connectivity edge cases before mass production.
What is the single biggest red flag when evaluating an OEM's NPI capability?
An inability or refusal to provide written EVT/DVT/PVT gate criteria and the corresponding measurement data.
What is TAILNTAIL's MOQ?
MOQ is determined during the engineering review phase based on the customization scope (cosmetic modification vs. full tooling development), the client's target market, and specific project requirements. Each project receives a tailored assessment rather than a one‑size‑fits‑all threshold.
Does TAILNTAIL provide firmware and app customization?
Yes. The OEM/ODM scope includes firmware customization, app integration, and OTA management, fully validated through the DVT firmware gate.
Strategic Decision Insight
A manufacturer that cannot provide documented gate criteria and test data carries elevated risk in bulk‑order commitments. The most affordable unit quote is rarely the lowest total cost of ownership: a DVT failure that forces a three‑month delay, plus tooling amortization, certification re‑submission, and potential field returns, outweighs any unit‑price saving.
For procurement teams evaluating long‑term OEM partnerships, manufacturers with measurable NPI controls, on‑site reliability testing infrastructure, and traceable certification records offer a fundamentally different risk profile from those competing primarily on unit price.
Next Step
Submit an inquiry through our website form, or contact the team directly:
E‑commerce – Ms. Chen +86 18028222607
Offline – Mr. Song +86 18128545238